-
About Jordan
About Jordan
-
Client Testimonials
Client Testimonials
-
Selling My Home
Selling My Home
-
Buying a Home
Buying a Home
-
Contact Jordan
Contact Jordan
About Jordan

Client Testimonials

Selling My Home

Buying a Home

Contact Jordan

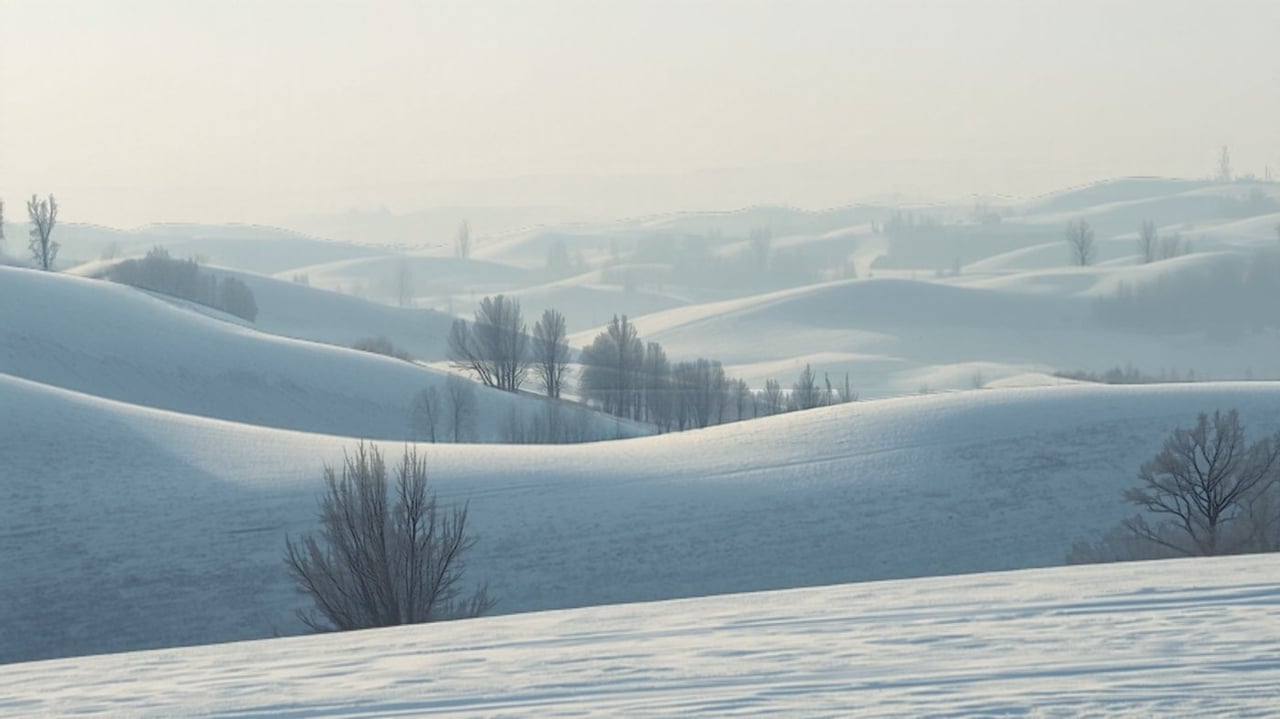
In Moscow, Idaho, average highs run from 36.4°F in December to 85.6°F in August, and average lows run from 21.6°F in December to 45.3°F in July. Those figures come from the 1991 to 2020 U.S. Climate Normals published by NOAA's National Centers for Environmental Information (NCEI) for the Moscow U OF I station. Precipitation is lowest in July (0.66 inches) and highest in November (3.52 inches), and snowfall averages 50.90 inches a year, with December the snowiest month at 15.50 inches.
| Month | Average high (°F) | Average low (°F) | Average precipitation (inches) | Average snowfall (inches) |
|---|---|---|---|---|
| January | 37.4 | 22.2 | 3.33 | 14.50 |
| February | 42.0 | 23.8 | 2.56 | 8.60 |
| March | 50.1 | 28.0 | 3.05 | 4.90 |
| April | 58.0 | 32.0 | 2.75 | 1.00 |
| May | 67.3 | 37.9 | 2.60 | 0.20 |
| June | 73.4 | 42.0 | 1.73 | 0.00 |
| July | 84.4 | 45.3 | 0.66 | 0.00 |
| August | 85.6 | 45.2 | 0.70 | 0.00 |
| September | 76.2 | 39.7 | 1.01 | 0.00 |
| October | 60.5 | 32.8 | 2.40 | 0.20 |
| November | 44.9 | 27.4 | 3.52 | 6.00 |
| December | 36.4 | 21.6 | 3.47 | 15.50 |
Each summary below uses only the table values.
Each row below comes from sorting the table values above.
| Measure | Highest three months | Lowest three months |
|---|---|---|
| Average high | August 85.6°F, July 84.4°F, September 76.2°F | December 36.4°F, January 37.4°F, February 42.0°F |
| Average low | July 45.3°F, August 45.2°F, June 42.0°F | December 21.6°F, January 22.2°F, February 23.8°F |
| Precipitation | November 3.52 inches, December 3.47 inches, January 3.33 inches | July 0.66 inches, August 0.70 inches, September 1.01 inches |
| Snowfall | December 15.50 inches, January 14.50 inches, February 8.60 inches | June, July, August, and September tie at 0.00 inches |
For housing in town, see Jordan's Moscow, Idaho area guide on homes, prices, and getting around.
Normals are 30 year averages, not a forecast, so any single month can come in warmer, cooler, wetter, or drier than the figures above. For current weather, the National Weather Service Spokane office is the local forecast office for the Moscow area, and the NWS publishes a forecast page for Moscow, ID. Both pages were available on October 21, 2026.
In Moscow, Idaho, January has an average high of 37.4°F and an average low of 22.2°F. It averages 3.33 inches of precipitation and 14.50 inches of snowfall. These are NOAA NCEI 1991 to 2020 normals for the Moscow U OF I station, as of October 21, 2026.
August has the highest average high in Moscow, Idaho at 85.6°F, with July close behind at 84.4°F. July has the highest average low at 45.3°F, just ahead of August at 45.2°F. Source: NOAA NCEI 1991 to 2020 normals, Moscow U OF I station, as of October 21, 2026.
December is the coolest month in Moscow, Idaho, with an average high of 36.4°F and an average low of 21.6°F. January is next at 37.4°F and 22.2°F. Source: NOAA NCEI 1991 to 2020 normals, Moscow U OF I station, as of October 21, 2026.
The NCEI annual snowfall normal for the Moscow U OF I station is 50.90 inches. December (15.50 inches) and January (14.50 inches) are the two snowiest months. These are 1991 to 2020 normals, as of October 21, 2026.
Moscow, Idaho has a nonzero snowfall normal in eight months. They are October (0.20 inches), November (6.00), December (15.50), January (14.50), February (8.60), March (4.90), April (1.00), and May (0.20). June through September are 0.00 inches. Source: NOAA NCEI 1991 to 2020 normals, as of October 21, 2026.
July is the driest month in Moscow, Idaho at 0.66 inches of precipitation, followed by August (0.70 inches) and September (1.01 inches). The July and August normals add up to 1.36 inches. Source: NOAA NCEI 1991 to 2020 normals, Moscow U OF I station, as of October 21, 2026.
The NCEI annual precipitation normal for the Moscow U OF I station is 27.78 inches. November is the wettest month at 3.52 inches, followed by December at 3.47 inches and January at 3.33 inches. These are 1991 to 2020 normals, as of October 21, 2026.
The National Weather Service Spokane office at weather.gov/otx is the local forecast office for Moscow, Idaho, and the NWS has a forecast page for Moscow, ID. Both were available on October 21, 2026. The numbers in this article are long term averages, not a current forecast.
Moving to the Palouse or comparing seasons before you buy? Start with the relocation resource or contact Jordan. You may also like these posts:
Details come from the sources linked above as of October 21, 2026 and can change. Jordan does not endorse or rate any business listed. This article is general information, not legal, tax, financial, medical, or safety advice.
Jordan Vorderbrueggen writes about buying and selling homes in Pullman, Moscow, and across the Palouse with Woodbridge Real Estate. Hard to Spell, Tough to Beat.
Browse active listings in the area or contact us for off-market listings.
Have an expert help you find out what your home is really worth.